|
|
|
|
Production Possibilities CurveA Production Possibilities Curve measures the maximum combination of outputs that can be obtained from a given number of inputs. It conveys the same information as the Production Possibilities Table but in graphical format. Below is the Production Possibilities Curve for the "Rice vs. Iron Ore" example. Notice that the graph is linear which reflects the constant Opportunity Costs. 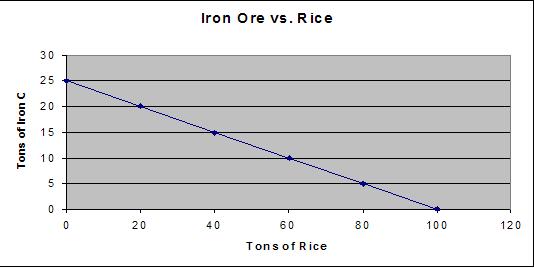 Next is the Production Possibilities Curve for the "Guns vs. Butter" example. Notice that the Curve is bowed outward. This reflects the Principle of Increasing Marginal Opportunity Costs we discussed in the previous section. 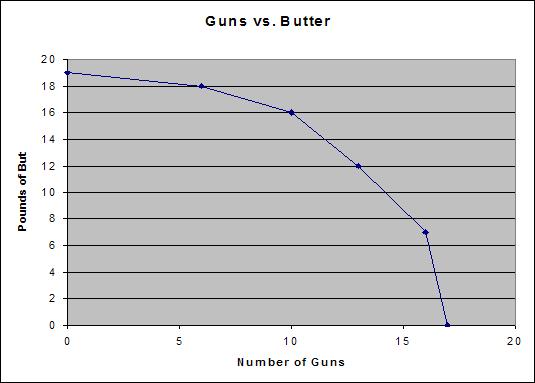 Back to Production Possibilities Model Back to Production Possibilities Model |
| Copyright 2006 Experimental Economics
Center. All rights reserved. | Send us
feedback |
|